 |
|
Wave and Tidal Energy
Wave and tidal energy harvesting has been around for a few decades. But it has only been in recent years that it has started to become more realistic due to advance in research and technology. Some speculates that wave and tidal energy can supply at least 10 percent of the world's energy consumption. How much power can be harvested is determined mainly on the wave activity. A map of wave heights is shown towards the end of the document.
Examples of Wave Energy Devices
The following are examples of devices that have been invented to harvest energy from waves and sea currents. They do not represent a complete list but they are divided into three main categories: on shore, off shore, and near shore. Each type has its own benefits and drawbacks covering issues such as efficeincy, cost per Watt, environmental and social impact.
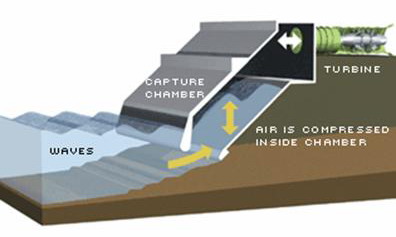
Oscillating Water Column (OWC)
This method uses waves to compress air in a closed chamber to generate wind which flows through a turbine. Wind is created both when the wave proceeds and recedes from the chamber. A special turbine is designed to spin in one direction regardless of the wind direction. This significiently increases the efficiency of the power generation process.
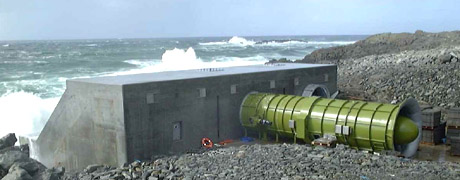
LIMPET is a prototype constructed in 2000 on the west coast of the Scottish island of Islay. It was capable of generating 500 kWatts, which is about 1/12 of the island's total power consumption.
Image Source: Popular Sciences and Wavegen Inc.
http://www.popsci.com and http://www.wavegen.com/
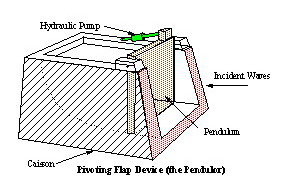
The Pivoting Flap Device
This device also creates a chamber for waves to push water in and out. It has a flap at the entrance which pivots back and forth as the wave enters and exists the chamber. This motion drives a hydraulic pump which drives the generator.
Image Source: World Energy Council
http://www.worldenergy.org/wec-geis/publications/reports/ser/wave/wave.asp
Tapered Channel Devices
This method uses the wave to pump sea water to an elevated reservoir. The trapped water can then be released back through a turbine generating electricity. The system in the image below is being tested in Trinidad California.
Image Source: Mindfully.org
http://www.mindfully.org/Energy/2004/Wave-Power-Trinidad4aug04.htm
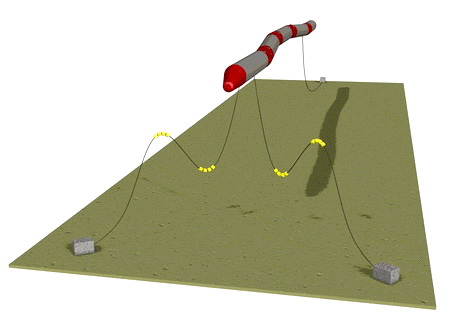
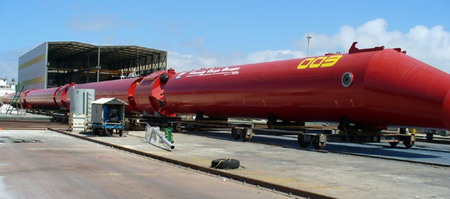
The Pelamis
This method works by creating a multi-segment floating tube anchored to the sea floor. The joints between each segment can move as the structure is hit by the waves. This motion is converted into energy through hydraulic cylinders which drives a hydraulic motor.
A company in Scotland named Ocean Power Delivery Ltd has created a pelamis that is 130m long and 2.3m in diameter. It is expected to generate 750 kWatts.
Image Source: Ocean Power Delivery Ltd
http://www.oceanpd.com
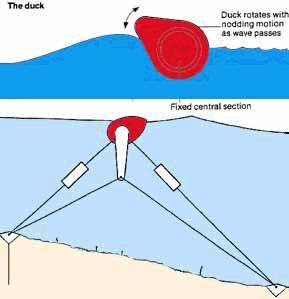
Buoyant Moored Device
This method creates motion by resisting the waves. One part of the system needs to be moored (anchored) to the sea floor while a second part moves as it resists the wave motion. Blow is an image of a system called the Duck created by Professor Salter at Edinburgh University. The base of the duck is moored to the sea floor while the duck itself (red) rotates with the wave motion. This rotation is used to generate energy.
Image Source: Fujita Research
http://www.fujitaresearch.com/reports/tidalpower.html
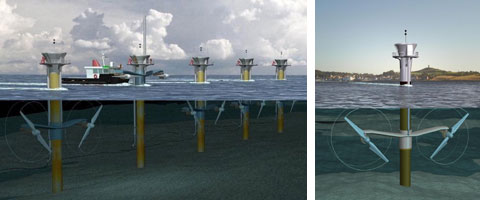
Tidal Turbines
This method works much the same way as wind turbines. However, since water is four times denser than air, the tidal turbine can be much smaller to generate the same amount of energy. The ideal water current is between 2-2.5 m/s, which is usually at depths of 20-30m within 1 km from the shore. A commercial scale turbine can produce 300 kWatts but this can scale up depending on the farm's size.
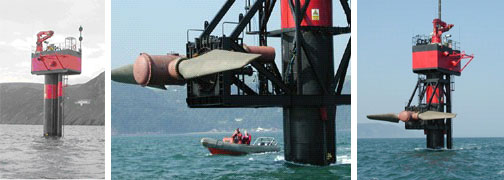
The image below shows "Seaflow," the world's first experimental tidal turbine. It is deployed in 2003 off the shore of Devon UK. It can produce 300 kWatts.
Image Source: British Wind Energy Association
http://www.bwea.com/marine/devices.html
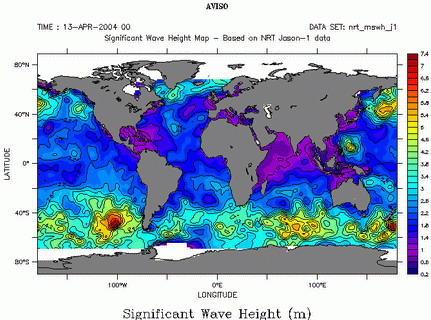
Wave Height Samples from Around the World
The following shows a snapshot of wave height from around the world. Although the weather and other factors can influence the measurements, the maps show a rough idea of wave activities expected in each region.
The world
Source: OCEANOGRAPHIE SPATIALE
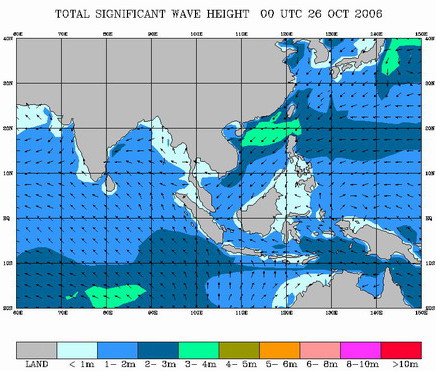
South East Asia
Source: National Environment Agency of Singapore
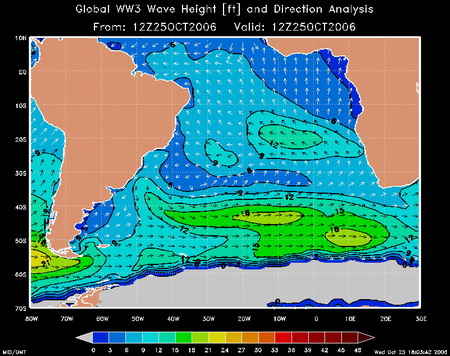
http://intranet.mssinet.gov.sg/marine/options.htmlSouth Atlantic
Resources:
- Wave Power: http://www.esru.strath.ac.uk/EandE/Web_sites/01-02/RE_info/wave%20power.htm
- Marine Renewable Energy: http://www.bwea.com/marine/devices.html
- Seadog: http://www.mindfully.org/Energy/2004/Wave-Power-Trinidad4aug04.htm
- Wave Power Generation and Mitigation of Beach Erosion for Long Island
- Fujita Research -Wave and tidal power: http://www.fujitaresearch.com/reports/tidalpower.html